7. Next Steps
Thus far, we have explored crime data using descriptive statistics and mapping techniques. However, we can iterate on this to further address possible user-needs that we brainstormed in the intro. In particular, we could:
Analyse the crime outcome data, so we understand crime and how it is being investigated.
Build on the interactive map to be a bokeh dashboard or flask app. We can include further plots alongside the map, such as the time-series plots. Indeed, we can embed time-series plots on the markers upon the user-clicking, similar to what is seen on the Quick Start guide.
As part of this, we can work with users to brainstorm KPIs which decision-makers can use to assess the performance of policy-measures to combat crime.
Model our crime data to understand the causes of crime within Camden and its wards. This can start off with a simple linear regression model to assess what factors can impact crime rates.
In particular, have street-light data and one hypothesis that has been proposed before is whether more street-lighting can reduce crime rates, particularly around night when it is dark. This hypothesis can be explored as we have street-light data.
If we find that street-lighting does impact crime rates significantly, then an policy question would be how you can optimise the number and distance of street lights within each ward to reduce this. A geo-spatial model can then be used for this.
This does depend on us having the data with timestamps though, so we can distinguish between crime that occurs during daylight and night-time.
Model our crime data to forecast levels of crime in the future, and how they compare across wards so law enforcement can prudently deploy resources and plan ahead. As we are using crime-rates, this would involve building a compositional time-series model so moving-average (MA), autoregressive (AR) and Autoregressive Integrated Moving Average (ARIMA) models can be explored.
Related to this, we can build a structural break model using Chow-tests and Kullback-Liebler divergence test to assess whether policy interventions on crime have had a significant impact on crime-rates.
Utilise graph databases and algorithms to model this geo-spatial data.
This ties in with (3.) where we can use a geo-spatial model to find the optimum number of street-lights and their distances from each other to reduce crime rates.
A graph-approach to modelling and visualising the data can also act as a visual aid to abstract away from the complexity associated with maps and thereby focus the audience’s attentions to the relationships between nodes such as crime and street-lights.
You could take a graph-approach to assess whether there is a relationship between wards with high-crime rates and are geographically-close (through a weighted relationship).
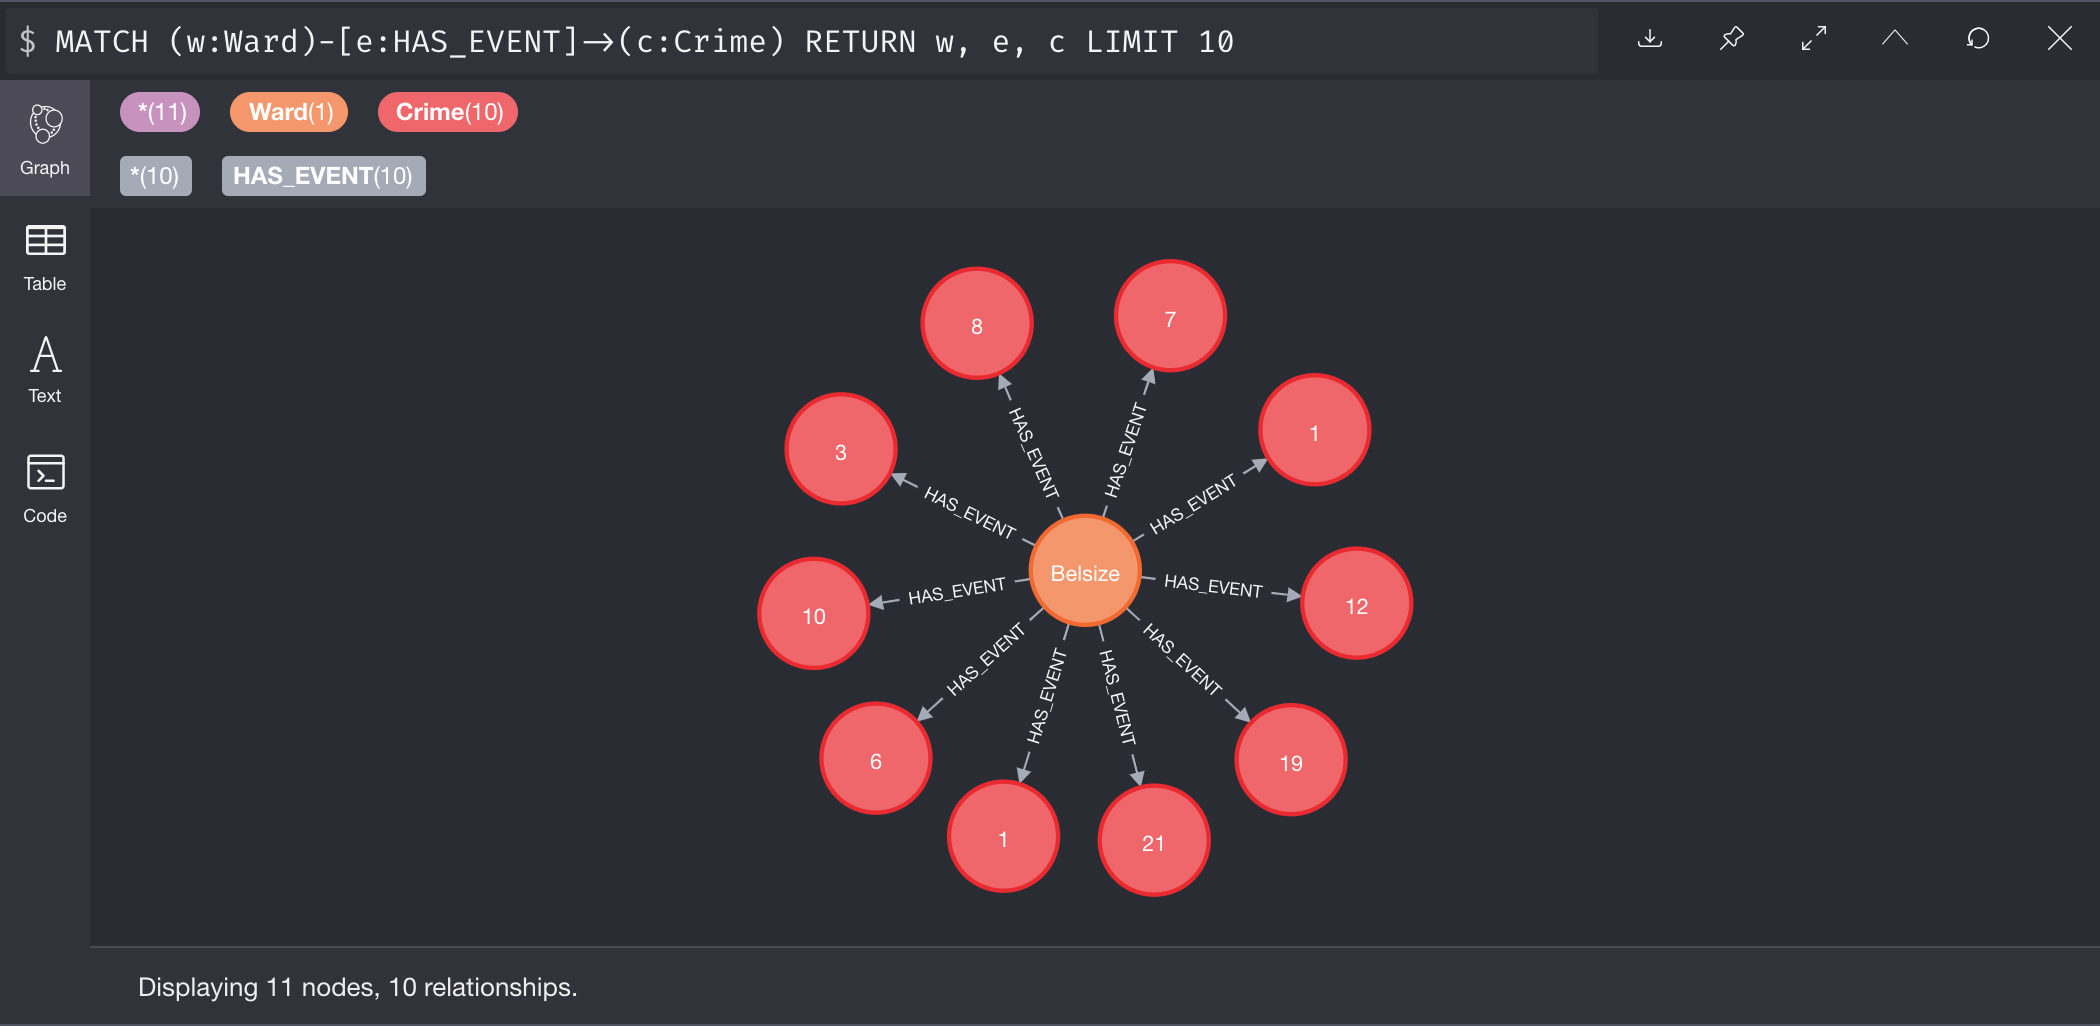
A starter script to import this data and visualise it in neo4j Sandbox, a cloud-hosted instance of neo4j’s graph database, is provided in
data/neo4j/crime_lamp.cypher. It has been imported and visualised. You can have a go by setting-up a free instance and importing the data in. (An example is found below)